From: Masnick M, Morgan DJ, Macek MD, Sorkin JD, Brown JP, Rheingans P, Harris AD. Improving the Understanding of Publicly Reported Healthcare-Associated Infection (HAI) Data. Infect Control Hosp Epidemiol 2016. [PubMed | PDF]
This is the final version of the survey instrument used in the manuscript cited above.
Patients were randomly assigned to one of two arms: (1) the new presentation method; (2) the existing "detailed" presentation method from CMS Hospital Compare.
The same underlying data is used for both arms; only the presentation method differs. Questions are presented in the same order for both arms.
Each question asked participants to select one possible answer from a list of options. The options were the same for all questions across both arms.
The survey questions for both arms follow below.
Questions are divided into 4 scenarios of 3 questions each:
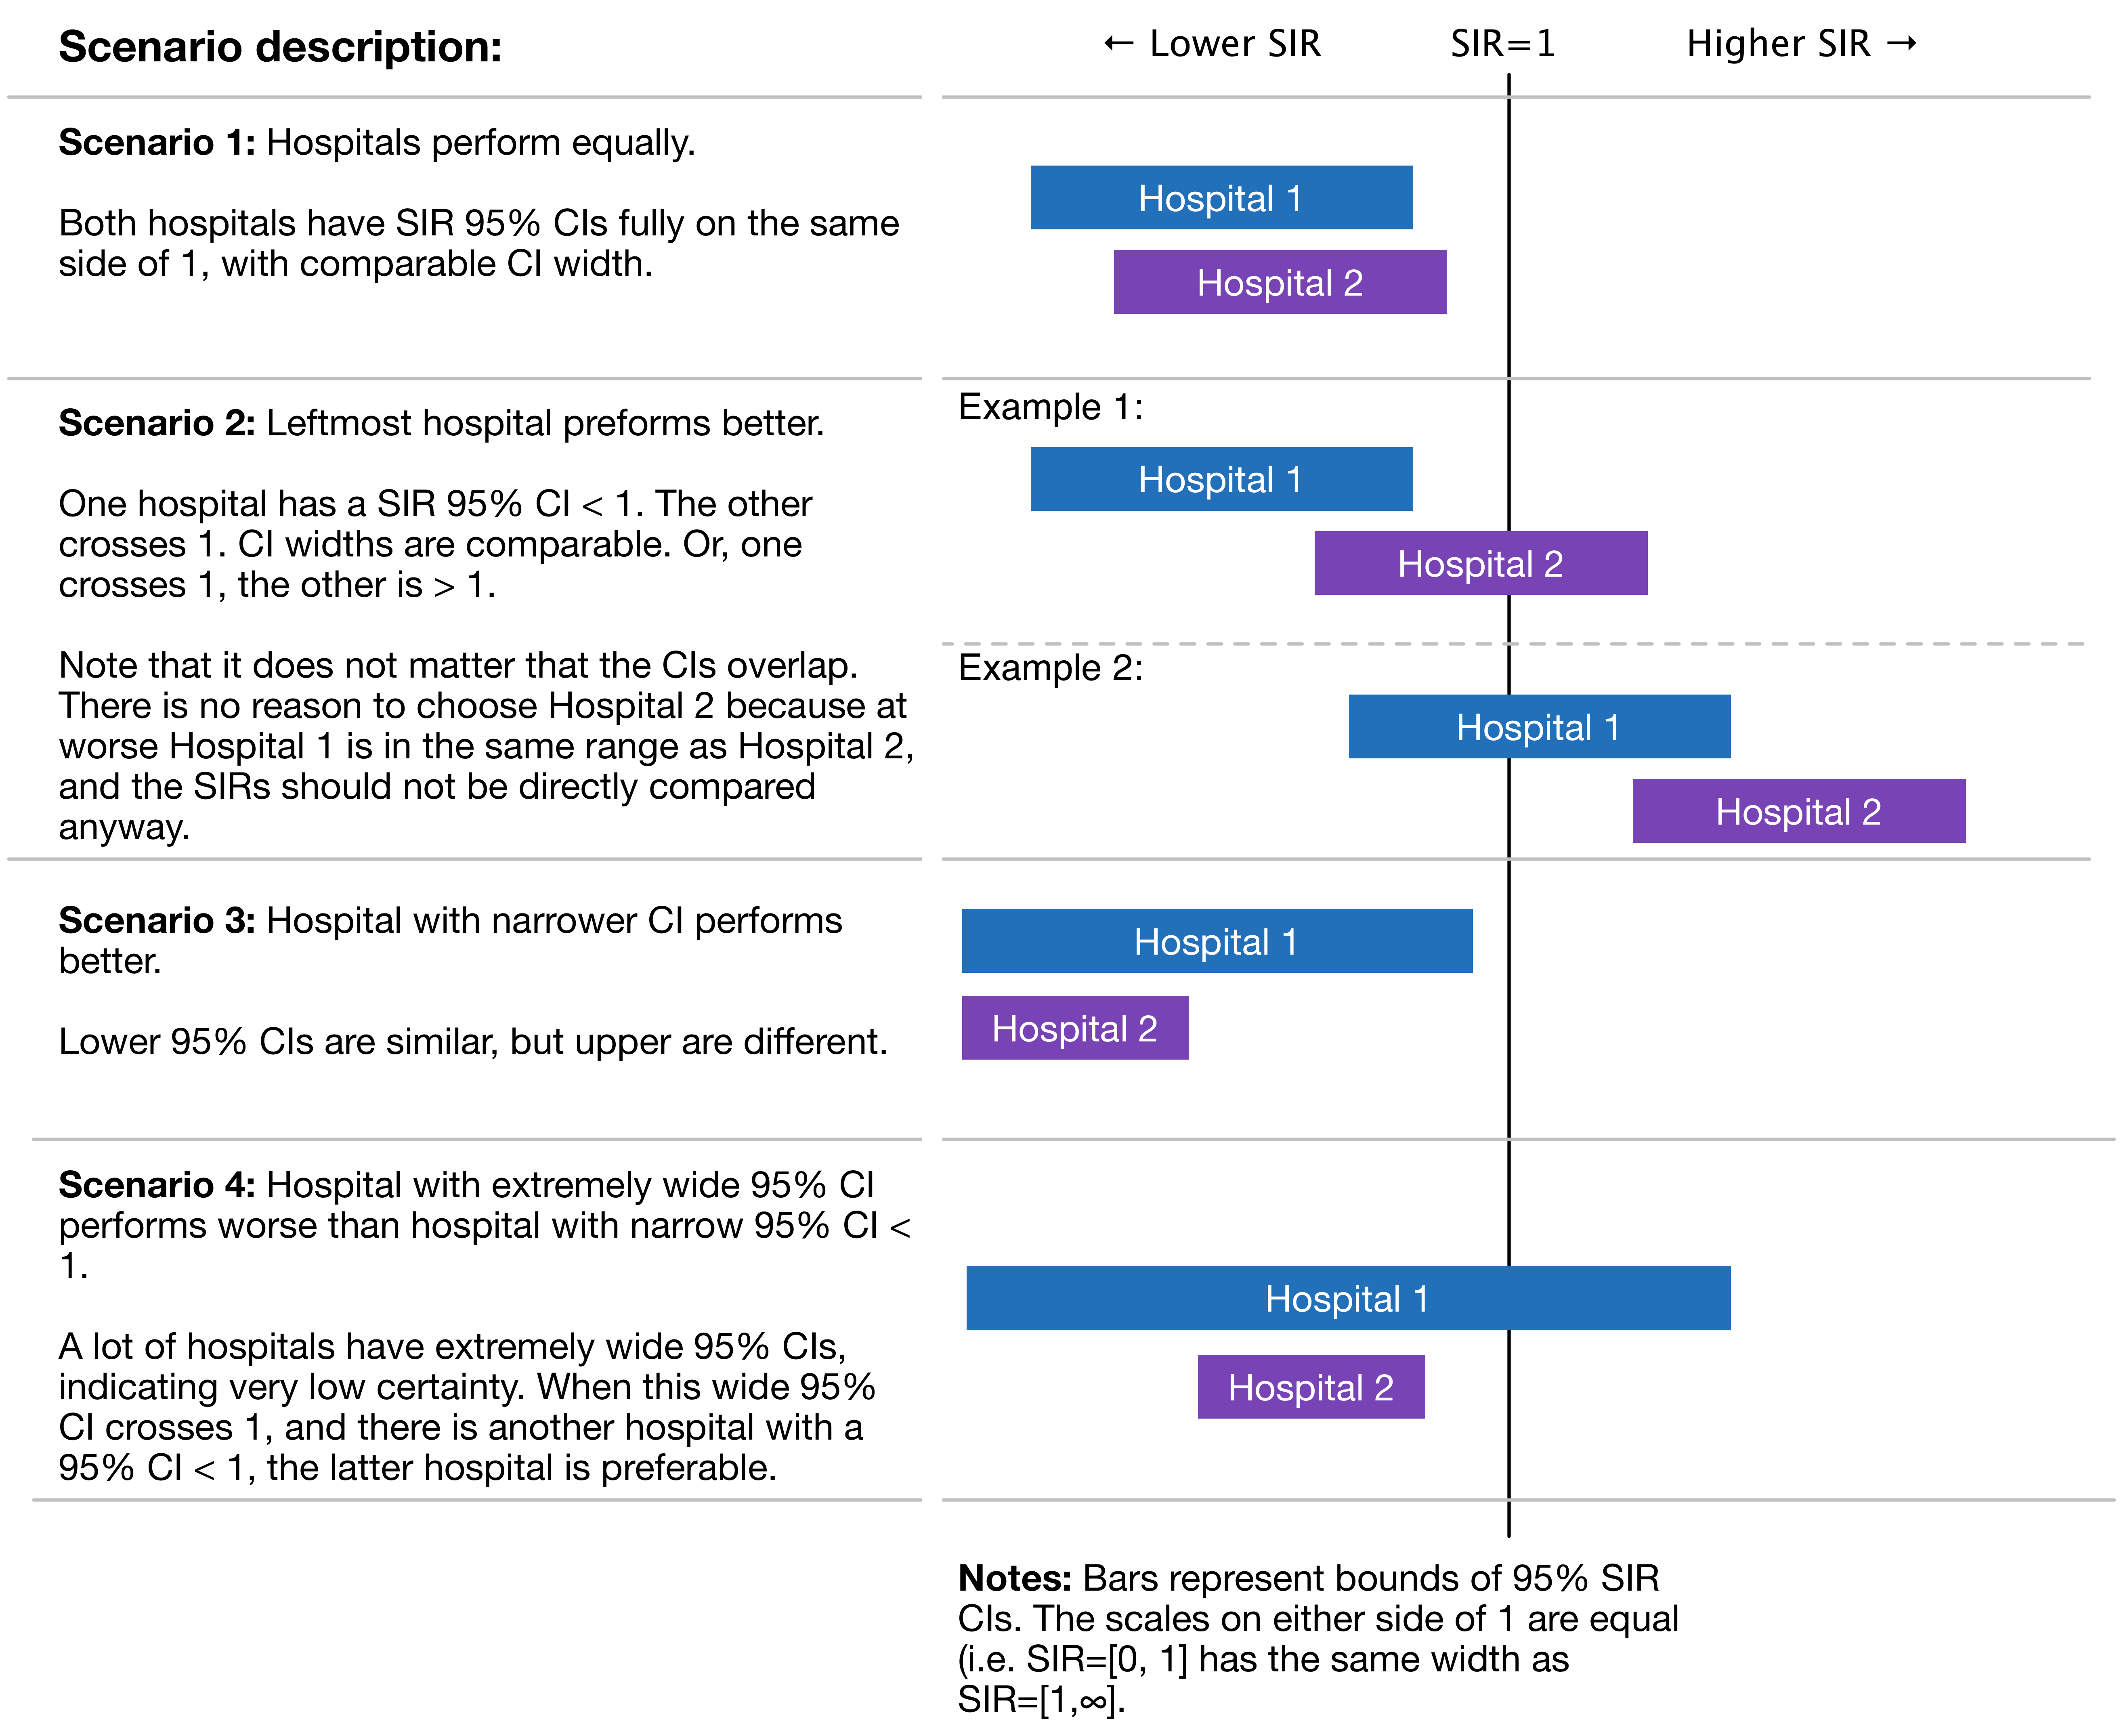
Questions are in order from 1 to 12 below, so questions in the same scenario are grouped together. In the actual survey administered to patients, they were shuffled into the following order for all respondents:
Question 8 Question 11 Question 2 Question 4 Question 5 Question 10 Question 9 Question 3 Question 12 Question 7 Question 6 Question 1
The new presentation method uses "dot ratings" to describe the performance of a hospital:
Infection dot rating | Description |
---|---|
●○○○ | 95% upper CI < 1; SIR point estimate < 0.42 (this is 1 SD for CAUTIs in the CMS Hospital Compare data) |
●●○○○ | 95% upper CI < 1; SIR point estimate between 0.42 and 1 |
●●●○○ | 95% upper CI > 1; SIR point estimate < 1 |
●●●●○ | 95% upper CI > 1; SIR point estimate between 1 and 2.4 (1 SD) |
●●●●● | 95% upper CI > 1; SIR point estimate > 2.4 (1 SD) |
Confidence dot rating | Description |
---|---|
High | High confidence: 1/2 of IQR or smaller; IQR = 6.63 for SIR 95% CI width for CAUTI |
Moderate | Moderate confidence: Between 1/2 IQR and 1 IQR |
Low | Low confidence: > 1 IQR |
# infections compared to expected | Confidence in data | ||
---|---|---|---|
Hospital 1 | ●●○○○ | High | |
Hospital 2 | ●●○○○ | High |
No. of infections reported (A) | Catheter Days |
Predicted No. Infections (B) | Standardized Infection Ratio (SIR) (A/B) |
Evaluation | |
---|---|---|---|---|---|
Hospital 1 | 8 | 7404 | 15.758 | 0.508 | Better than the U.S. National Benchmark |
Hospital 2 | 9 | 8328 | 17.182 | 0.524 | Better than the U.S. National Benchmark |
Standardized infection ratio (SIR) national benchmark = 1.
Lower SIRs are better. A score of (0) – meaning no CAUTIs – is best.
Which hospital would you choose based only on the CAUTI information in the blue rectangle?
New method arm (n, %) | Control arm (n, %) | Total (n, %) | |
---|---|---|---|
Hospital 1 | 1 (3.3%) | 17 (56.7%) | 18 (30%) |
Hospital 2 | 4 (13.3%) | 3 (10%) | 7 (11.7%) |
Either | 20 (66.7%) | 9 (30%) | 29 (48.3%) |
Not sure | 5 (16.7%) | 2 (6.7%) | 7 (11.7%) |
# infections compared to expected | Confidence in data | ||
---|---|---|---|
Hospital 1 | ●●●●○ | Medium | |
Hospital 2 | ●●●●○ | Medium |
No. of infections reported (A) | Catheter Days |
Predicted No. Infections (B) | Standardized Infection Ratio (SIR) (A/B) |
Evaluation | |
---|---|---|---|---|---|
Hospital 1 | 13 | 5955 | 9.285 | 1.4 | No different than the U.S. National Benchmark |
Hospital 2 | 13 | 5340 | 9.288 | 1.4 | No different than the U.S. National Benchmark |
Standardized infection ratio (SIR) national benchmark = 1.
Lower SIRs are better. A score of (0) – meaning no CAUTIs – is best.
Which hospital would you choose based only on the CAUTI information in the blue rectangle?
New method arm (n, %) | Control arm (n, %) | Total (n, %) | |
---|---|---|---|
Hospital 1 | 5 (16.7%) | 2 (6.7%) | 7 (11.7%) |
Hospital 2 | 4 (13.3%) | 6 (20%) | 10 (16.7%) |
Either | 19 (63.3%) | 22 (73.3%) | 41 (68.3%) |
Not sure | 2 (6.7%) | 1 (3.3%) | 3 (5%) |
# infections compared to expected | Confidence in data | ||
---|---|---|---|
Hospital 1 | ●●●●● | Medium | |
Hospital 2 | ●●●●● | Medium |
No. of infections reported (A) | Catheter Days |
Predicted No. Infections (B) | Standardized Infection Ratio (SIR) (A/B) |
Evaluation | |
---|---|---|---|---|---|
Hospital 1 | 8 | 1567 | 2.352 | 3.401 | Worse than the U.S. National Benchmark |
Hospital 2 | 7 | 1392 | 2.089 | 3.351 | Worse than the U.S. National Benchmark |
Standardized infection ratio (SIR) national benchmark = 1.
Lower SIRs are better. A score of (0) – meaning no CAUTIs – is best.
Which hospital would you choose based only on the CAUTI information in the blue rectangle?
New method arm (n, %) | Control arm (n, %) | Total (n, %) | |
---|---|---|---|
Hospital 1 | 2 (6.7%) | 3 (10%) | 5 (8.3%) |
Hospital 2 | 3 (10%) | 14 (46.7%) | 17 (28.3%) |
Either | 22 (73.3%) | 13 (43.3%) | 35 (58.3%) |
Not sure | 3 (10%) | 1 (3.3%) | 4 (6.7%) |
# infections compared to expected | Confidence in data | ||
---|---|---|---|
Hospital 1 | ●○○○○ | Medium | |
Hospital 2 | ●●●○○ | Medium |
No. of infections reported (A) | Catheter Days |
Predicted No. Infections (B) | Standardized Infection Ratio (SIR) (A/B) |
Evaluation | |
---|---|---|---|---|---|
Hospital 1 | 7 | 10936 | 23.077 | 0.303 | Better than the U.S. National Benchmark |
Hospital 2 | 6 | 3659 | 6.164 | 0.973 | No different than the U.S. National Benchmark |
Standardized infection ratio (SIR) national benchmark = 1.
Lower SIRs are better. A score of (0) – meaning no CAUTIs – is best.
Which hospital would you choose based only on the CAUTI information in the blue rectangle?
New method arm (n, %) | Control arm (n, %) | Total (n, %) | |
---|---|---|---|
Hospital 1 | 19 (63.3%) | 10 (33.3%) | 29 (48.3%) |
Hospital 2 | 6 (20%) | 19 (63.3%) | 25 (41.7%) |
Either | 1 (3.3%) | (NaN%) | 1 (1.7%) |
Not sure | 4 (13.3%) | 2 (6.7%) | 6 (10%) |
# infections compared to expected | Confidence in data | ||
---|---|---|---|
Hospital 1 | ●●○○○ | High | |
Hospital 2 | ●●●○○ | High |
No. of infections reported (A) | Catheter Days |
Predicted No. Infections (B) | Standardized Infection Ratio (SIR) (A/B) |
Evaluation | |
---|---|---|---|---|---|
Hospital 1 | 53 | 32423 | 81.17 | 0.653 | Better than the U.S. National Benchmark |
Hospital 2 | 60 | 29713 | 74.888 | 0.801 | No different than the U.S. National Benchmark |
Standardized infection ratio (SIR) national benchmark = 1.
Lower SIRs are better. A score of (0) – meaning no CAUTIs – is best.
Which hospital would you choose based only on the CAUTI information in the blue rectangle?
New method arm (n, %) | Control arm (n, %) | Total (n, %) | |
---|---|---|---|
Hospital 1 | 19 (63.3%) | 13 (43.3%) | 32 (53.3%) |
Hospital 2 | 8 (26.7%) | 5 (16.7%) | 13 (21.7%) |
Either | 1 (3.3%) | 8 (26.7%) | 9 (15%) |
Not sure | 2 (6.7%) | 5 (16.7%) | 7 (11.7%) |
# infections compared to expected | Confidence in data | ||
---|---|---|---|
Hospital 1 | ●●●●○ | High | |
Hospital 2 | ●●●○○ | High |
No. of infections reported (A) | Catheter Days |
Predicted No. Infections (B) | Standardized Infection Ratio (SIR) (A/B) |
Evaluation | |
---|---|---|---|---|---|
Hospital 1 | 51 | 15682 | 29.847 | 1.709 | Worse than the U.S. National Benchmark |
Hospital 2 | 46 | 15788 | 48.753 | 0.944 | No different than the U.S. National Benchmark |
Standardized infection ratio (SIR) national benchmark = 1.
Lower SIRs are better. A score of (0) – meaning no CAUTIs – is best.
Which hospital would you choose based only on the CAUTI information in the blue rectangle?
New method arm (n, %) | Control arm (n, %) | Total (n, %) | |
---|---|---|---|
Hospital 1 | 4 (13.3%) | 3 (10%) | 7 (11.7%) |
Hospital 2 | 18 (60%) | 14 (46.7%) | 32 (53.3%) |
Either | 3 (10%) | 10 (33.3%) | 13 (21.7%) |
Not sure | 5 (16.7%) | 4 (13.3%) | 9 (15%) |
# infections compared to expected | Confidence in data | ||
---|---|---|---|
Hospital 1 | ●●○○○ | High | |
Hospital 2 | ●●○○○ | Medium |
No. of infections reported (A) | Catheter Days |
Predicted No. Infections (B) | Standardized Infection Ratio (SIR) (A/B) |
Evaluation | |
---|---|---|---|---|---|
Hospital 1 | 14 | 11560 | 32.134 | 0.436 | Better than the U.S. National Benchmark |
Hospital 2 | 7 | 8421 | 15.279 | 0.458 | Better than the U.S. National Benchmark |
Standardized infection ratio (SIR) national benchmark = 1.
Lower SIRs are better. A score of (0) – meaning no CAUTIs – is best.
Which hospital would you choose based only on the CAUTI information in the blue rectangle?
New method arm (n, %) | Control arm (n, %) | Total (n, %) | |
---|---|---|---|
Hospital 1 | 13 (43.3%) | 4 (13.3%) | 17 (28.3%) |
Hospital 2 | 8 (26.7%) | 19 (63.3%) | 27 (45%) |
Either | 5 (16.7%) | 7 (23.3%) | 12 (20%) |
Not sure | 4 (13.3%) | 1 (3.3%) | 5 (8.3%) |
# infections compared to expected | Confidence in data | ||
---|---|---|---|
Hospital 1 | ●●○○○ | High | |
Hospital 2 | ●●○○○ | Medium |
No. of infections reported (A) | Catheter Days |
Predicted No. Infections (B) | Standardized Infection Ratio (SIR) (A/B) |
Evaluation | |
---|---|---|---|---|---|
Hospital 1 | 60 | 51610 | 93.98 | 0.638 | Better than the U.S. National Benchmark |
Hospital 2 | 6 | 5475 | 12.862 | 0.466 | Better than the U.S. National Benchmark |
Standardized infection ratio (SIR) national benchmark = 1.
Lower SIRs are better. A score of (0) – meaning no CAUTIs – is best.
Which hospital would you choose based only on the CAUTI information in the blue rectangle?
New method arm (n, %) | Control arm (n, %) | Total (n, %) | |
---|---|---|---|
Hospital 1 | 11 (36.7%) | 6 (20%) | 17 (28.3%) |
Hospital 2 | 9 (30%) | 16 (53.3%) | 25 (41.7%) |
Either | 7 (23.3%) | 6 (20%) | 13 (21.7%) |
Not sure | 3 (10%) | 3 (10%) | 6 (10%) |
# infections compared to expected | Confidence in data | ||
---|---|---|---|
Hospital 1 | ●●○○○ | Medium | |
Hospital 2 | ●●○○○ | High |
No. of infections reported (A) | Catheter Days |
Predicted No. Infections (B) | Standardized Infection Ratio (SIR) (A/B) |
Evaluation | |
---|---|---|---|---|---|
Hospital 1 | 6 | 4284 | 13.599 | 0.441 | Better than the U.S. National Benchmark |
Hospital 2 | 78 | 62316 | 135.192 | 0.577 | Better than the U.S. National Benchmark |
Standardized infection ratio (SIR) national benchmark = 1.
Lower SIRs are better. A score of (0) – meaning no CAUTIs – is best.
Which hospital would you choose based only on the CAUTI information in the blue rectangle?
New method arm (n, %) | Control arm (n, %) | Total (n, %) | |
---|---|---|---|
Hospital 1 | 7 (23.3%) | 26 (86.7%) | 33 (55%) |
Hospital 2 | 13 (43.3%) | 2 (6.7%) | 15 (25%) |
Either | 5 (16.7%) | 1 (3.3%) | 6 (10%) |
Not sure | 5 (16.7%) | 2 (6.7%) | 7 (11.7%) |
# infections compared to expected | Confidence in data | ||
---|---|---|---|
Hospital 1 | ●●●●○ | Low | |
Hospital 2 | ●●○○○ | High |
No. of infections reported (A) | Catheter Days |
Predicted No. Infections (B) | Standardized Infection Ratio (SIR) (A/B) |
Evaluation | |
---|---|---|---|---|---|
Hospital 1 | 2 | 569 | 1.138 | 1.757 | No different than the U.S. National Benchmark |
Hospital 2 | 32 | 20545 | 45.247 | 0.707 | Better than the U.S. National Benchmark |
Standardized infection ratio (SIR) national benchmark = 1.
Lower SIRs are better. A score of (0) – meaning no CAUTIs – is best.
Which hospital would you choose based only on the CAUTI information in the blue rectangle?
New method arm (n, %) | Control arm (n, %) | Total (n, %) | |
---|---|---|---|
Hospital 1 | 9 (30%) | 21 (70%) | 30 (50%) |
Hospital 2 | 19 (63.3%) | 8 (26.7%) | 27 (45%) |
Either | (NaN%) | (NaN%) | (NaN%) |
Not sure | 2 (6.7%) | 2 (6.7%) | 4 (6.7%) |
# infections compared to expected | Confidence in data | ||
---|---|---|---|
Hospital 1 | ●●●○○ | Low | |
Hospital 2 | ●●●○○ | High |
No. of infections reported (A) | Catheter Days |
Predicted No. Infections (B) | Standardized Infection Ratio (SIR) (A/B) |
Evaluation | |
---|---|---|---|---|---|
Hospital 1 | 1 | 717 | 1.077 | 0.929 | No different than the U.S. National Benchmark |
Hospital 2 | 81 | 44278 | 97.305 | 0.832 | No different than the U.S. National Benchmark |
Standardized infection ratio (SIR) national benchmark = 1.
Lower SIRs are better. A score of (0) – meaning no CAUTIs – is best.
Which hospital would you choose based only on the CAUTI information in the blue rectangle?
New method arm (n, %) | Control arm (n, %) | Total (n, %) | |
---|---|---|---|
Hospital 1 | 9 (30%) | 18 (60%) | 27 (45%) |
Hospital 2 | 14 (46.7%) | 9 (30%) | 23 (38.3%) |
Either | 6 (20%) | 1 (3.3%) | 7 (11.7%) |
Not sure | 1 (3.3%) | 3 (10%) | 4 (6.7%) |
# infections compared to expected | Confidence in data | ||
---|---|---|---|
Hospital 1 | ●●●○○ | Low | |
Hospital 2 | ●●○○○ | High |
No. of infections reported (A) | Catheter Days |
Predicted No. Infections (B) | Standardized Infection Ratio (SIR) (A/B) |
Evaluation | |
---|---|---|---|---|---|
Hospital 1 | 1 | 727 | 1.092 | 0.916 | No different than the U.S. National Benchmark |
Hospital 2 | 62 | 38404 | 82.116 | 0.755 | Better than the U.S. National Benchmark |
Standardized infection ratio (SIR) national benchmark = 1.
Lower SIRs are better. A score of (0) – meaning no CAUTIs – is best.
Which hospital would you choose based only on the CAUTI information in the blue rectangle?
New method arm (n, %) | Control arm (n, %) | Total (n, %) | |
---|---|---|---|
Hospital 1 | 11 (36.7%) | 20 (66.7%) | 31 (51.7%) |
Hospital 2 | 14 (46.7%) | 7 (23.3%) | 21 (35%) |
Either | 3 (10%) | 1 (3.3%) | 4 (6.7%) |
Not sure | 2 (6.7%) | 3 (10%) | 5 (8.3%) |