October 30, 2012
Wolfram Alpha and Probability Distributions
I just discovered you can use Wolfram Alpha to replace a critical values table for common probability distributions. You can also quickly graph distributions. This is super helpful for the introductory statistics class I'm taking now.
There's some documentation about how to do this on Wolfram Alpha, but it wasn't clear how to structure the queries to get results along the lines of what you'd find in a critical values table. To make this easier, I've created some widgets here along with the queries used to build them.
Whaaa?
Let's say I want to find:
$$ z \textrm{ such that } P(Z<z)=0.95 $$
The following Wolfram Alpha query will give me the answer: normal distribution probabilities mean=0 standard deviation=1 probability=0.95.
The results for this query are:
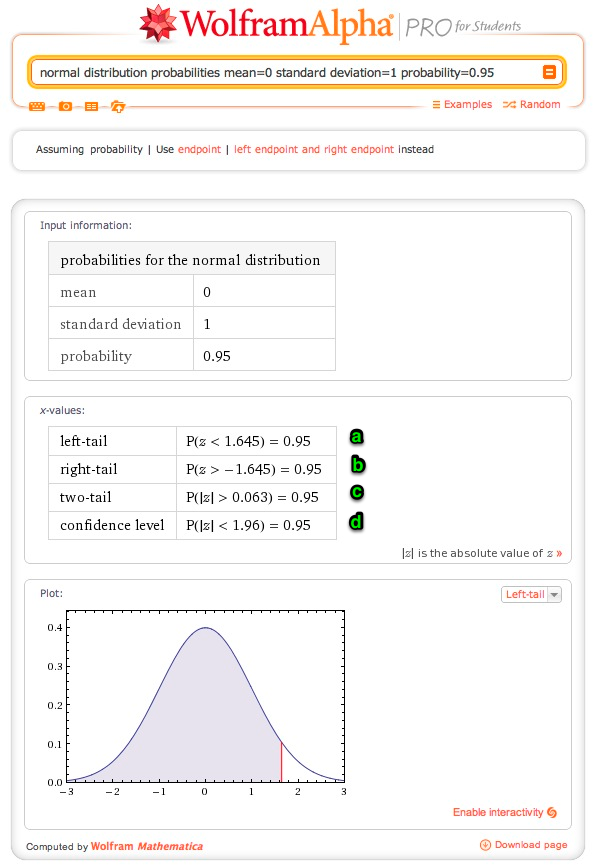
The line marked a is the one that I want. This tells me that if z=1.645, the left-tail probability will be 0.95. This value for z is also marked on the graph with the red line, and you can see that the area of the shaded region of the graph is 0.95.
You can reverse this to find the probability for a specific value of z or use a different distribution entirely. However, constructing these queries by hand gets a little cumbersome, so I've created some widgets to make it easier. If you want to bookmark the widgets directly, use this link.
Probability distribution widgets
How to use: Enter the desired values and click "Submit". The results will open in a popup window (check your popup blocker if it doesn't work).
If you get an error message or want to see the full query, click this button  in the bottom right hand corner of the results popup.
For more on interpreting the results, see the top of this page.
Normal distribution
T distribution
F distribution
Comments? Please send me a message.