Reproducibility in Data Analysis
Last updated: January 18, 2021
.md file used to generate them.
Reproducibility means each time you run your analysis with the same inputs, you get the same outputs.
Code is the .r file or .py file you wrote.
Data are your raw data files (e.g., .csv).
Environment is the system that runs your code and any dependencies. For example, the version of R that you’re using and any external packages needed to run your code.
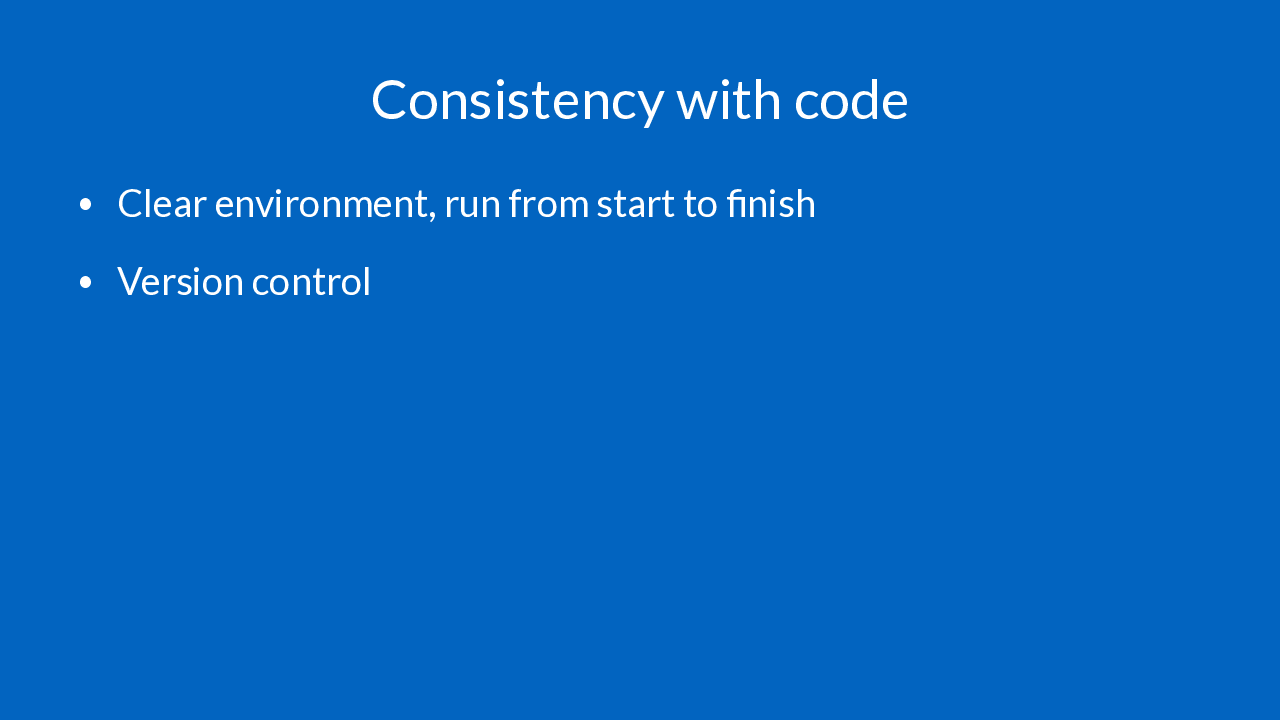
The simplest thing you can do to make sure your code produces consistent results is to re-run from start to finish with a clean environment (meaning that you restart R or Python to ensure there aren’t left-over dataframes in memory your code could be depending on).
You also need some sort of version control. This could be as simple as creating copies of the files with time stamps in the file names, but a better practice is to use a version control system like git.
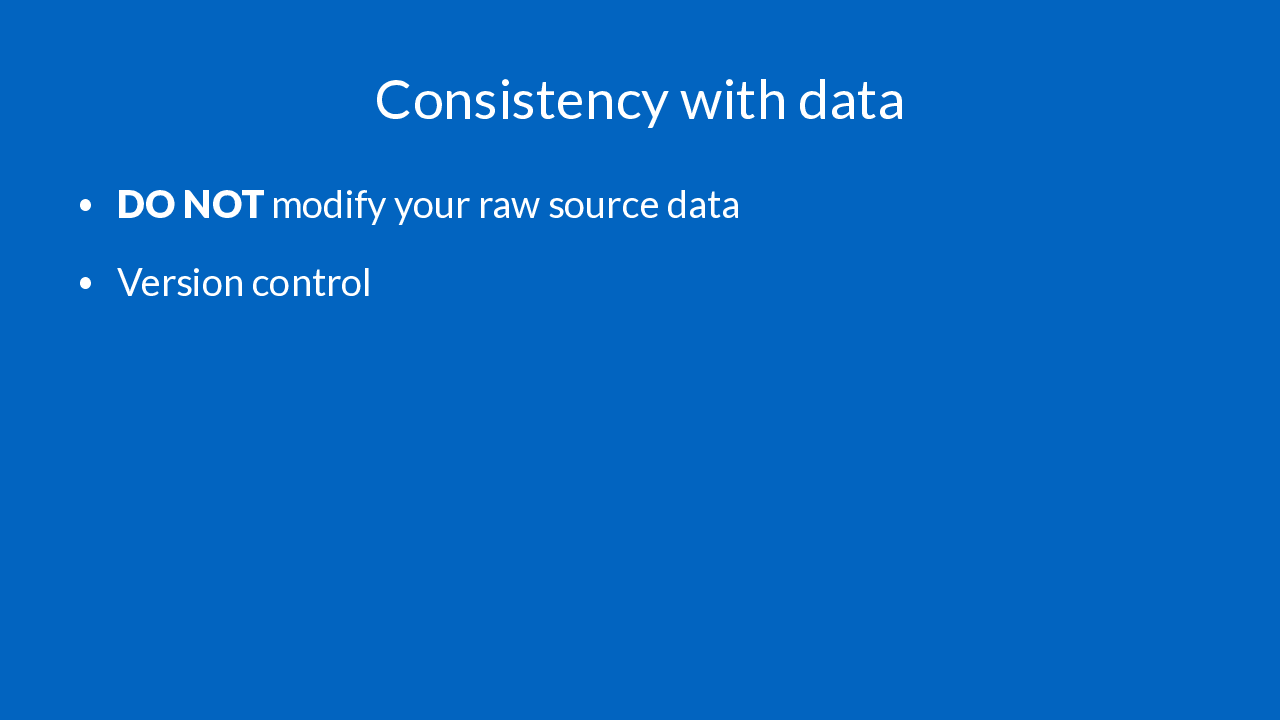
The best thing you can do to avoid issues with data consistency is to never modify your source data. I like to keep a copy of source data in a .zip file, which prevents accidental modification.
If you have multiple versions of source data, figure out some sort of system for version control. Again, this could be a simple as .zip files with time stamps in their names. You can also use git for data, though that doesn’t work well with large datasets and may be problematic for sensitive data.
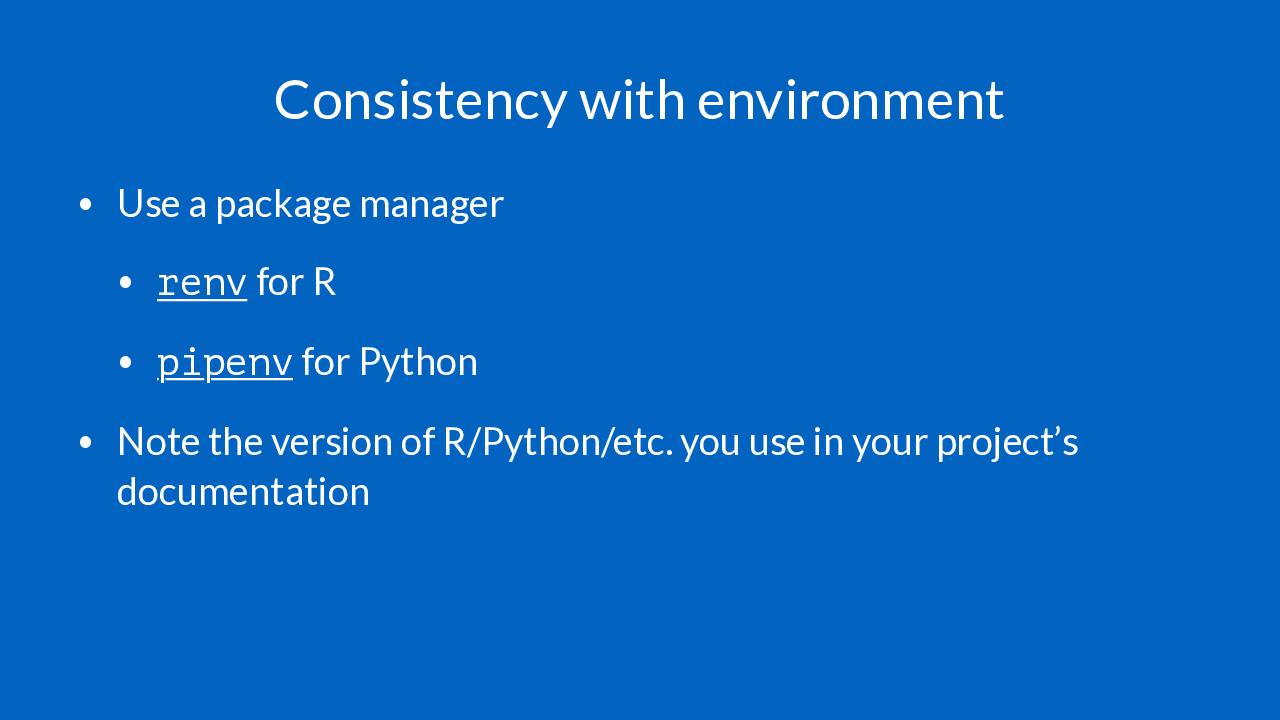
Package managers make it possible to re-load the exact same set of external packages on a new computer (or on a collaborator’s computer). Unless you have a good reason to use something else, as of April 2020 you should use renv for R and pipenv for Python.
You should also note the version of the interpreter for the programming language you’re using in your project documentation.
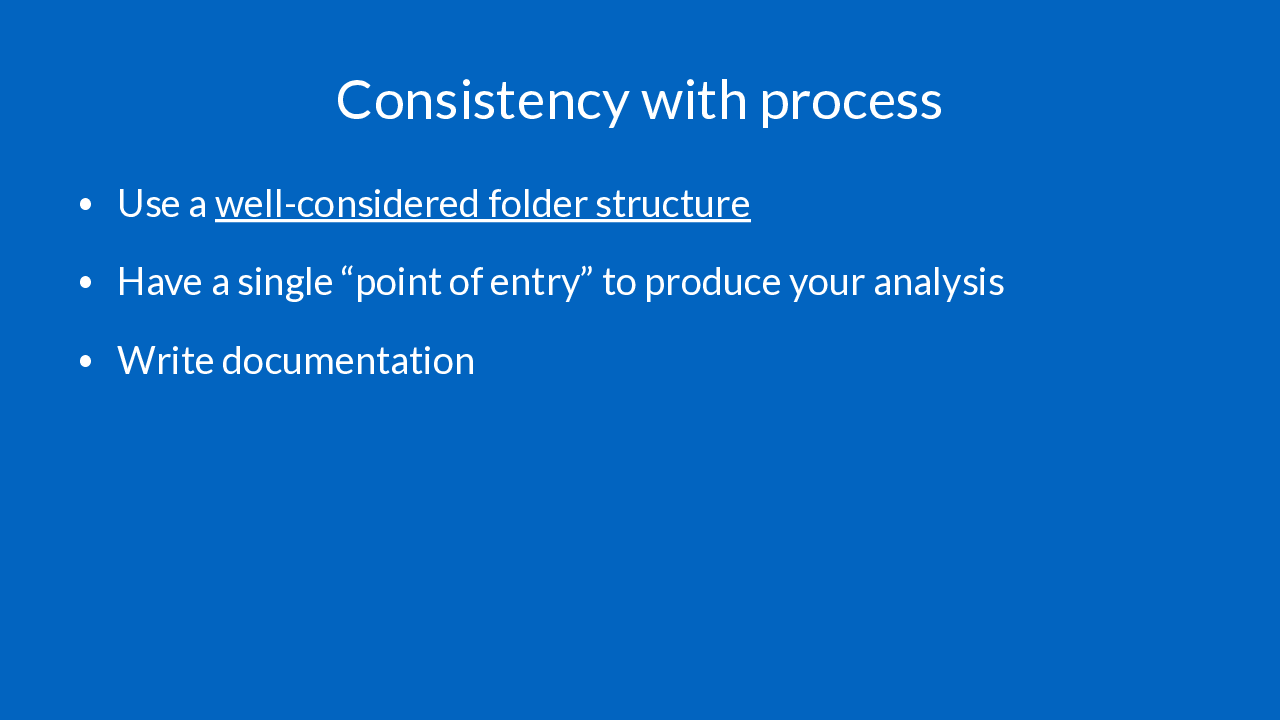
I use the same folder structure for all my data analysis projects. This makes it easy to find files, and is constructed to promote good practices for reproducibility.
You should have a single “point of entry” to produce your analysis. For me this is often the README file in my project folder: in this I explain exactly what to run in order to run all parts of the analysis. Another option is a single “orchestrator” script responsible for running the entire analysis that either contains all the analysis code (though this is bad if the code is long) or calls out to separate files. The key thing is that all the analysis needs to run through the “point of entry” and this needs to be readily discoverable. A README in the root project folder is by definition discoverable, as is a file named _run_all.R (which will sort to the top of file lists due to the _).
See below for more on documentation.
From low to high level:
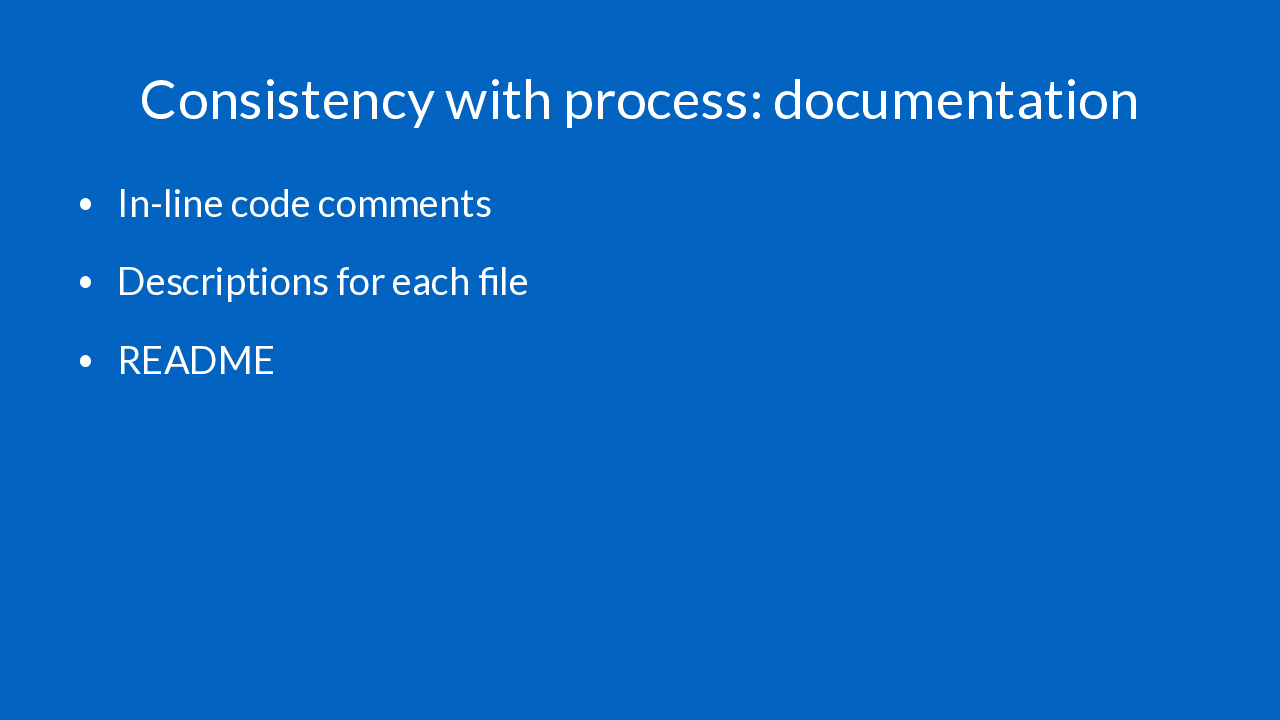
- You should have comments interspersed with your analysis code. I recommend brief descriptions for each “chunk” of code, plus longer comments explaining anything complex or unintuitive. You should write enough comments so a competent programmer who had never seen your code before could quickly understand what was going on. (Note: this person is most likely you, 6 months from now.)
- At the top of each file (or class/function/method if you’re writing more complex programs), you should have a longer description explaining a high level what the purpose of the file is, and what the expected inputs and outputs are.
- Finally, you should have a README in the root level of your project explaining the purpose of the project and how to run it.
I’ve mentioned version control a few times. The most common way to version control source code is with software called git along with a website called GitHub. git is out of scope for today, but you can learn more here.
🌟 Was this page helpful?
Please let me know with this quick, 3 question survey.
