R Markdown
Last updated: January 18, 2021
Table of contents:
Chunk options
These are the things that go after the {r above a code block that control how R Markdown displays the output:
```{r Chunk name goes here, cache=TRUE, eval=FALSE, dpi=100}
```
See chunk options and package options for details. Useful ones:
message=FALSEto hide output from commands likelibrary(tidyverse)echo=FALSEto hide code in knitted document
Customizing tables
Export as vanilla Markdown
This is helpful if you want to feed an R Markdown file into something that only works with “vanilla” Markdown. Add the following to the frontmatter to get this (source):
---
output:
  md_document:
    variant: markdown_mmd
---
(This gives you MultiMarkdown format output. Use variant: markdown for true vanilla Markdown.)
Markdown tables
If you want to convert R objects into Markdown tables, the pander package can help:
m <- mtcars[1:2, 1:3]
pandoc.table(m, style = "rmarkdown")
# | | mpg | cyl | disp |
# |:-------------------:|:-----:|:-----:|:------:|
# | **Mazda RX4** | 21 | 6 | 160 |
# | **Mazda RX4 Wag** | 21 | 6 | 160 |PDF output and LaTeX
The R Markdown book recommends TinyTeX rather than MacTeX. I follow this recommendation for systems that don’t already have LaTeX set up.
More on TinyTeX here. Note that it can be used for LaTeX document processing outside of R.
rticles: write journal articles in R Markdown
rticles is a package from the RStudio folks that takes R Markdown, converts it to LaTeX, and then formats it based on the submission guidelines for an academic journal.
Publication-quality tables
This can be done with knitr::kable and kableExtra:
mtcars[1:5, 1:3] %>%
  knitr::kable(
    format = "html",
    booktabs = TRUE, # For LaTeX
    col.names = c("MPG", "Cylinders", "Displacement"),
    caption = "Example table caption.",
    digits = 1
  ) %>%
  add_header_above(c("", "Example header over 3 columns" = 3)) %>%
  kable_styling(bootstrap_options = "striped", full_width = F)
Here’s what the output of this looks like:
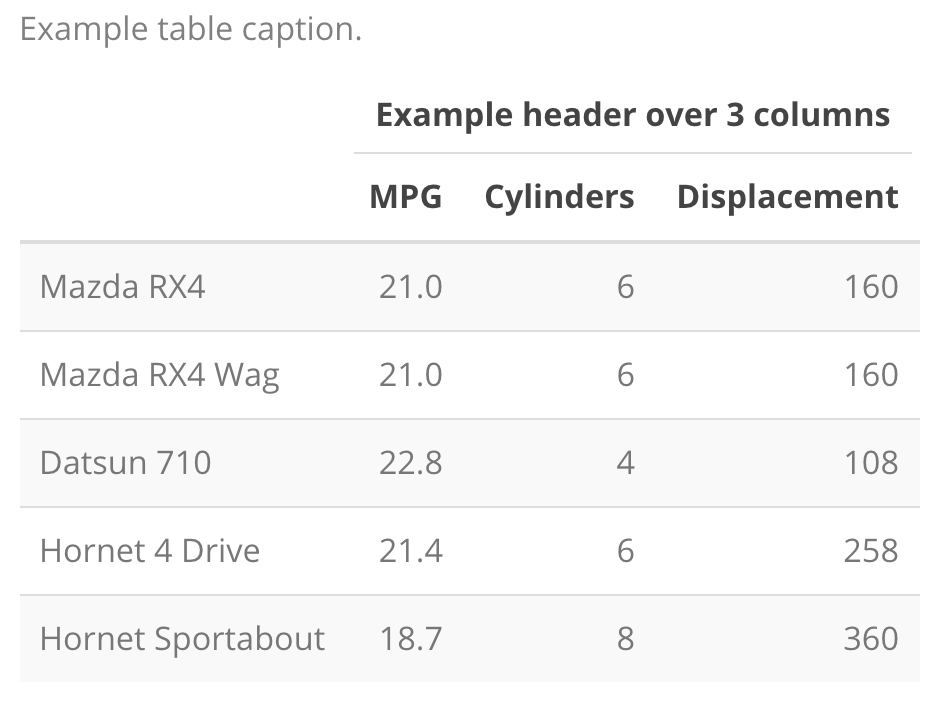
Example of the HTML output of knitr.
The format = "html" option is helpful for showing content when working in RStudio, but it must be changed to "latex" when knitting to PDF. I typically do format = table_format, and then set table_format based on whether the document is knitting or not:
table_format <- "html"
if(isTRUE(getOption('knitr.in.progress'))) {
  table_format <- "latex"
}
Table and figure numbers
Set this in the frontmatter to get table and figure numbers:
header-includes:
  - \usepackage[labelfont=bf,singlelinecheck=false]{caption}
Formatting integers and percentages
I use these helper functions with inline R to add commas to large integers and show percentages with one decimal:
f_pct <- function(n) {
  return(str_c(sprintf('%.1f', n), "%"))
}
f_int <- function(n) {
  return(format(n, big.mark=","))
}

# Use like `r f_int(1000)` in R Markdown to get "1,000".
Resources
- R Markdown official documentation
- knitr official documentation
- Emi Tanaka’s slideds on communicating data with R Markdown
- R Markdown: The Definitive Guide
- Ulrik Lyngs: How to Write ACM Articles with R Markdown
- Composing reproducible manuscripts using R Markdown | Labs | eLife
ℹ️ This page is part of my knowledge base for R, the popular statistical programming language. I attempt to use idiomatic practices with the tidyverse collection of packages as much as possible. If you have suggestions for ways to improve this code, please contact me or use the survey link below..